Will Vog-Shrouded West Hawai’i Real Estate Valuations be next on Kilauea’s Hit List?
As Q2 2018 closed in a volcanic haze that shrouded West Hawaii’s famous sunsets, so did sales data showing some worrisome indicators for the south Kohala and Kona area real estate market. A developing sales trend may impact both potential buying and sellers, and Hawai’i County officials who are struggling to balance growing budget needs.
The direct and indirect economic and social impacts from the recent volcanic uptick are only just beginning to be fully understood. However, the impacts are real enough for lower Puna families who have suffered greatly, but have come together as a community in the best aspects of Hawaii’s unique aloha spirit. At last count 700 homes have been destroyed and nearly $380 million in taxable real estate turned into fields of lava.
All this begs the question: Will vog-shrouded West Hawai’i real estate valuations be next on the Kilauea hit list?
Perhaps the possibility of shrinking property valuations in the lucrative property tax-areas of south Kohala and the greater Kona will give Hawai’i County officials more to ponder? These areas regularly covered by voggy views and the after-effects of laze and voggy haze, producing stinging eyes, coughing, and choking from the air both visitors and residents equally breathe.
The recent upsurge in Kilauea’s eruption activity has produced a consistent number of vog-shrouded days for south Kohala and Kona that have become the norm, rather than the exception. West Hawaii’s tourist trade has already felt the impact of vog-covered skies, with area residents and businesses struggling to adjust to this new environmental reality. While the local Costco now stocks gas masks, Guy Hagi (Hawaii News Now’s high profile weather guy) extols the virtues of “no worries”, proclaiming clear skies and helpful trade winds from his distant Oahu perch.
West Hawai’i real estate sales data at the close of the second quarter looked mostly normal, however, on closer examination there was a noticeable drop in sales closings at the end of June that does not bode well for an uncertain future governed by a restless volcano or the near term prospects for clear skies and the return of West Hawaii’s famous sunsets.
Second quarter 2018 data for home and condo sales consisted mostly of offers written in February and prior to the recent increase in Kilauea eruption activities and air-polluted views. While it’s too early tell, this recent trend indicates a potential link between the island’s recent uptick in volcanic activity and a late Q2 decline in area sales numbers.
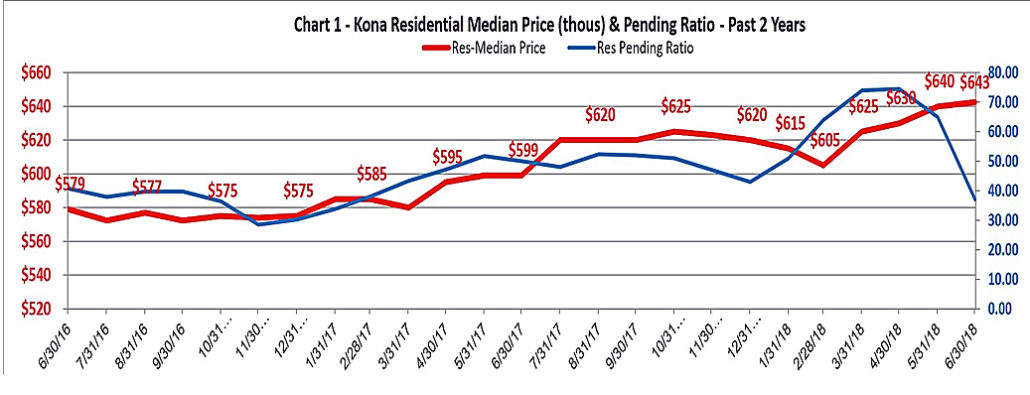
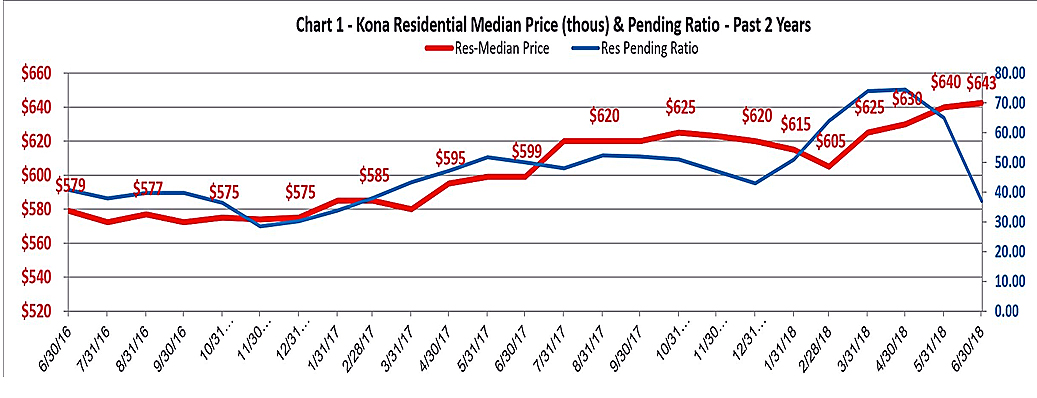
The two year Kona area real estate sales chart (shown below) illustrates this developing economic trend in detail, with the chart’s blue line representing the “sales pending ratio”, which is the number of escrows per 100 listings for the Kona residential market. Note, how the number of sales in escrow for late June 2018 that appear to have fallen off a cliff — a trend not normally associated with historic and seasonal sales data for the same period from recent years. The last time a lower ratio sales for this period occurred was June 2011.
If this trend continues, experts predict “a prolonged decrease in units sold, lower sales values and prices will follow.” And, when home and condo values drop, County property tax revenues follow.
The real estate market, like the stock market, goes up and down and each has its own market cycles, but only Hawai’i Island has a volcano and a fire goddess named Pele, who since 1983 never sleeps.


great article