Hawaii Climate News – May 2021
Climate change presents Hawaii and mid-Pacific Islands with a set of unique challenges including: rising temperatures, sea-level rise, contamination of freshwater resources with saltwater, coastal erosion, an increase in extreme weather events, coral reef bleaching, and ocean acidification. Hawaii’s marine coral systems were significantly damaged during an unprecedented warming event of 2015-16, which killed off over 90% of native coral in some coastal areas and permanently damaged West Hawaii’s once robust coral system.
Scientific studies project for the rest of the 21st century a continuing rise in air and ocean surface temperatures for the Pacific, increased hurricane intensities and the frequency of extreme weather events. Along with these changes, increased rainfall during the summer months and a decrease in rainfall during the winter months.
In Hawai’i, the annual rainfall has decreased and surface temperatures have risen during the last several decades, but it is unknown whether these trends will persist or be enhanced through global climate change. Coastal areas will certainly be at increased risk due to greater hurricane wind speeds and coastal inundation due to the combined effects of sea-level rise and storm surges, e.g. West Maui today.
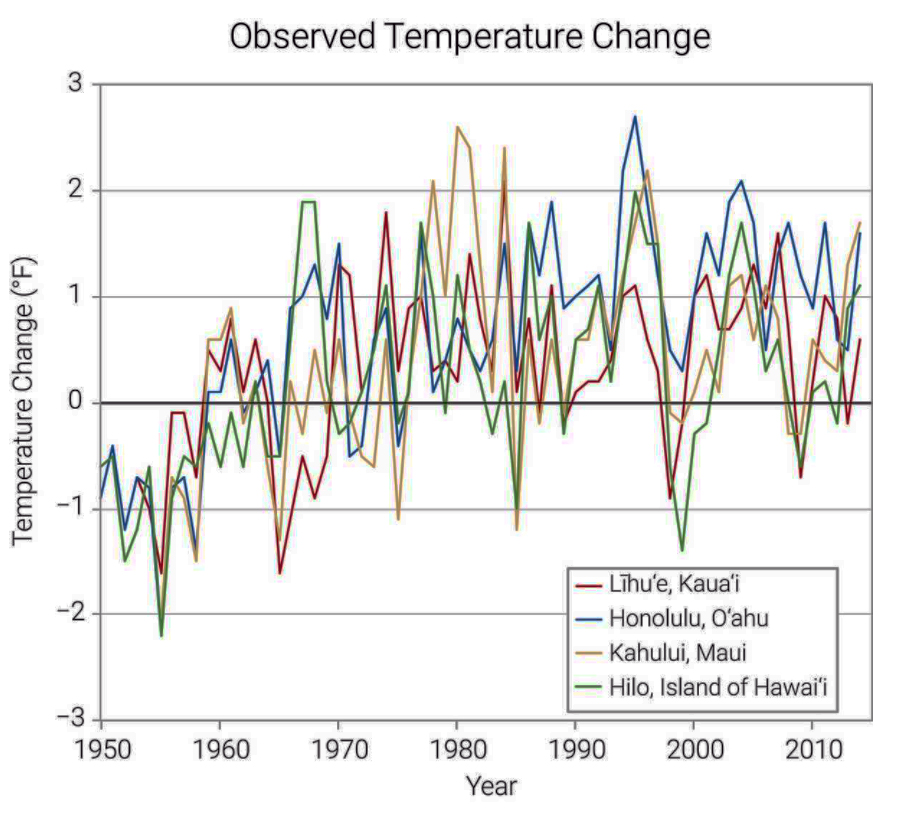
Since 1950, temperatures across the Hawaiian Islands have risen by about 2°F.
Temperatures in Honolulu have increased by 2.3°F over this period and have consistently been above the 1951–1980 average since 1975 (Figure 2).
Both the number of hot days (days with maximum temperature above 90°F) and number of warm nights (days with minimum temperature above 75°F) have been near to above average since 1980.
The rate of temperature increase is greatest at high elevations, far exceeding the global average rate of change. The annual number of days below freezing is decreasing over time, as is the diurnal temperature range, largely due to nighttime warming.
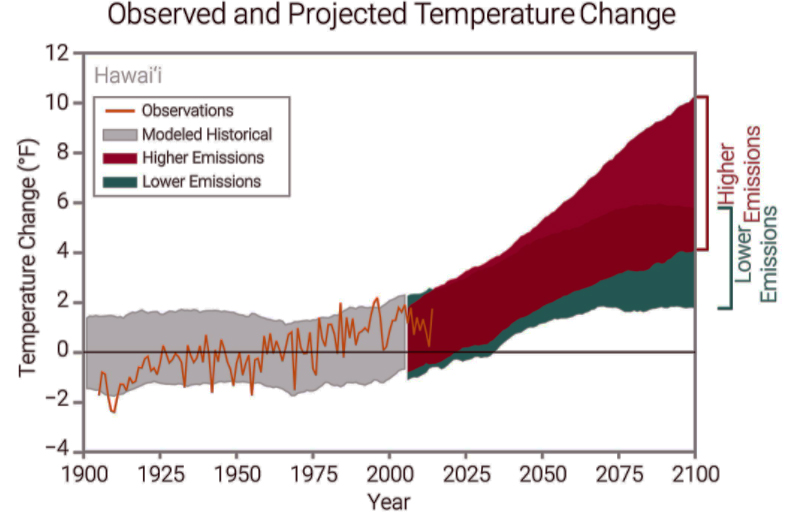
Temperatures in Hawai‘i (orange line) have risen about 2°F since the beginning of the 20th century.
Historically unprecedented warming is projected during the 21st century.
Less warming is expected under a lower emissions future (the coldest years being about as warm as the hottest year in the historical record; green shading) and more warming under a higher emissions future (the hottest years being about 8°F warmer than the hottest year in the historical record; red shading).
Source: CICS-NC and NOAA NCEI.
The Climate – Weather Link 
Hurricane season in a warming Pacific Ocean is becoming longer and stronger. Before 2000, the eastern Pacific hurricane season started in May less than half of the time. Since 2000, it has been more than 70 percent of the time.
Hawaii Ocean Temperatures on the Rise
Observed changes (compared to the 1951–1980 average) in annual near-surface air temperature for four stations in Hawai‘i: Līhu‘e, Kaua‘i (red line), Honolulu, O‘ahu (blue line), Kahului, Maui (yellow line), and Hilo, Island of Hawai‘i (green line).
Data are for 1950–2015. Temperatures across the islands have increased since 1950, at rates of between 0.2°F and 0.4°F per decade.
Temperatures in Honolulu have increased by 2.3°F over this period and have consistently been above the 1951–1980 average since 1975.
Source: CICS-NC and NOAA NCEI.
Rainfall
Precipitation varies greatly by both season and location. Hawai‘i experiences a drier season from May through October, in which warm, steady trade winds cause frequent light-to-moderate showers, and a wet season from November through April, with weaker and less frequent trade winds and a significant amount of rain from storms.
The mountainous terrain, persistent trade winds, heating and cooling of the land, and other factors interact to result in dramatic differences in average rainfall over short distances. Annual total rainfall sometimes exceeds 300 inches along the windward slopes of mountains, but less than 20 inches in leeward coastal areas and the highest mountain slopes. Despite great variability in precipitation amounts across the islands over the past century, annual rainfall has decreased throughout the island chain, particularly during recent years.
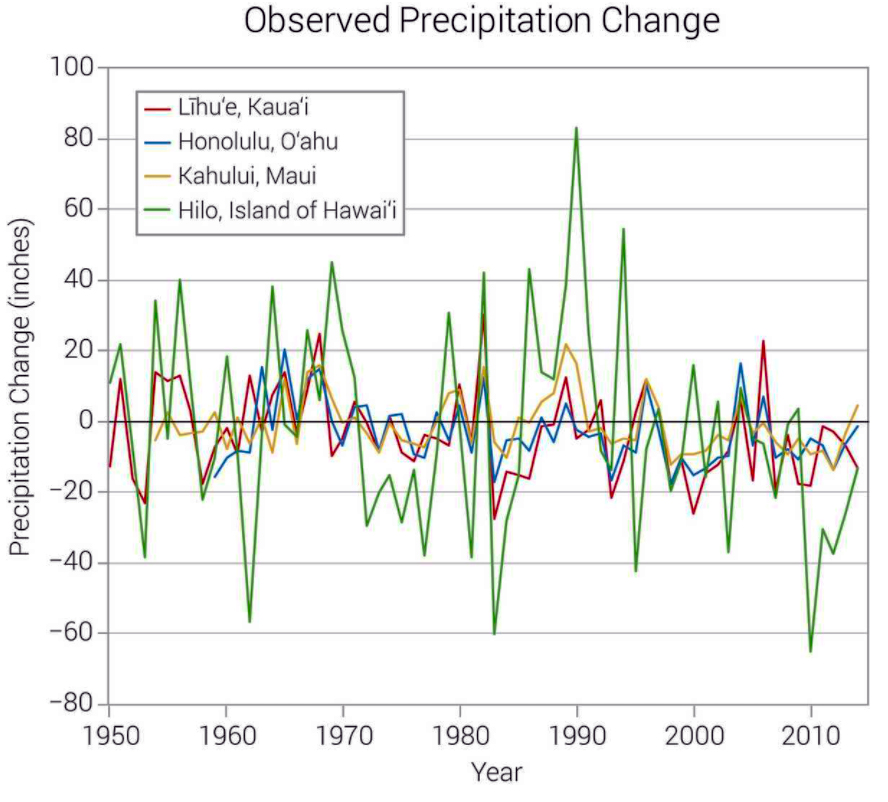
The Big Island
The Island of Hawai‘i has experienced the largest significant long-term declines in annual and dry season rainfall, with annual total precipitation in Hilo decreasing the most among four major airports: a decrease of almost 20 inches since 1950.
An increase in the frequency of the trade wind inversion is also linked to a decrease in precipitation at high elevations.
Hilo not so wet
The Hilo side of Hawaii Island, generally referred to as the wet side of the Big Island, is demonstrating greatest swings in wet-to-dry and wet again, year upon year since 1950.
Annual precipitation varies greatly from year to year, however, overall amounts have decreased since 1950 at all four stations. The greatest decrease has been seen in Hilo, where annual precipitation has decreased by almost 20 inches across the period of record
Hawaiian Islands
The number of consecutive dry days across the major Hawaiian Islands has become longer since 1950s. An increase in drought conditions has been seen in recent years, particularly at high elevations. In 2010, more than 40 percent of the Hawaiian Islands experienced severe, extreme, or exceptional drought conditions. Such conditions lead to a lack of useable water and increased risk of fire. On the other side of the coin, the number of extreme precipitation events has been below average in recent years, with areas at the highest elevations experiencing the strongest downward trend.
Regionally, extreme rainfall events have become less frequent for O‘ahu and Kauai, but more frequent for the Island of Hawai‘i. Water, weather are the enablers for the staples of life, and as for Hawaii’s future livability like the rest of the world that is certainly the case…
Source: CICS-NC and NOAA NCEI.
Sea level rise in Hawai‘i
Increasing temperatures raise concerns for sea level rise in Hawai‘i. 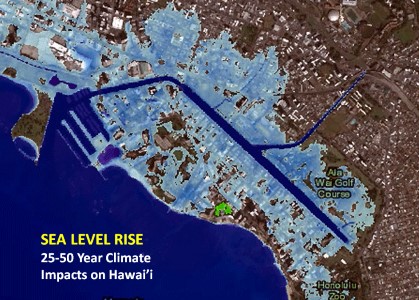
Since 1880, global sea level has risen by about 8 inches. It is projected to rise another 1 to 4 feet by 2100 as a result of both past and future emissions due to human activities.
Rates of sea level rise in Hawai‘i vary between the islands, ranging from 0.6 inches per decade for Kaua‘i and O‘ahu to 1.3 inches per decade on the Island of Hawai‘i.
Sea level rise across Hawai‘i is projected to rise another 1–3 feet by the end of the 21st century.
Sea level rise has caused an increase in tidal floods associated with nuisance-level impacts. Nuisance floods are events in which water levels exceed the local threshold (set by NOAA’s National Weather Service) for minor impacts. These events can damage infrastructure, cause road closures, and overwhelm storm drains.
As sea level has risen along the Hawaiian coastline, the number of tidal flood days (all days exceeding the nuisance level threshold) has also increased, with the greatest number occurring in 2002–2003. Continued sea level rise will present major challenges to Hawai‘i’s coastline, through coastal inundation and erosion.
Seventy percent of Hawai‘i’s beaches have already been eroded over the past century, with more than 13 miles of beach completely lost. Sea level rise will also affect Hawai‘i’s coastal water management system and could cause extensive economic damage through ecosystem damage and losses in property, tourism, and agriculture.

Leave a Reply
Join the Community discussion now - your email address will not be published, remains secure and confidential. Mahalo.